
Introduction
The Department of Education (ED) plays a critical and indispensable role in our national K-12 education system. Dismantling and dispersing its responsibilities among other federal agencies will likely widen the gaps between “red” and “blue” states in meeting students’ educational needs. The ED fulfills its role as a federal bridge in areas where states are unprepared to meet students’ needs in their entirety.
Partisan politics frequently use K–12 metrics as political weapons to promote programs tied to their political agenda. Blue states like MA, NJ, and CT often point to high spending as proof that investing heavily in public education works. While red states like MS, FL, and TX point to fast-improving, lower-spending states as proof that conservative instructional reforms work.
As I pointed out in my essay, The Fallacy of Single-Metric Evaluation: Education is a Complex Adaptive System, public education is a complex adaptive system1, where as many as ten non-school factors-like poverty, housing, health, or toxins-exert a greater influence on student outcomes than classroom instruction alone. The impact these non-school factors exert on student outcomes varies widely from state to state. This points to a rationale for a federal role in bridging existing gaps between states, which are primarily responsible for meeting students’ education needs. I like to think of the ED as the arbiter that ensures equal access to resources that level the playing field for state-to-state programming or for students educated in different states.
A detailed analysis of red and blue state educational data points to no single “partisan model” holding a monopoly on educational excellence. While Democratic states (blue) excel at building large-scale social safety nets and funding equality, high-performing Republican (red) states excel at targeted instructional and curricular changes that close student achievement gaps. However, since both models face distinct systemic blind spots, the U.S. Department of Education remains indispensable, serving as the national referee preventing regional policy failures from undermining the nation’s 50 million students.
The “Raw vs. Adjusted” Paradox: What the Test Scores Actually Tell Us
When you look at raw NAEP scores, there is a blue-state advantage over red states. Unadjusted NAEP reading and math scores consistently favor Northeastern Blue states (MA, NJ, CT) over Southern Red states (TX, MS, AL, and LA). Table 1 summarizes average reading and math NAEP test scores for 8th graders over the past five years.2
| Metric Cohort | Blue States Average (MA, CT, NJ) | Red States Average (TX, MS, AL, LA) | NAEP National Public School Average Test Scores |
| 8th-Grade Reading (Raw) | ~268 | ~253 | ~260 |
| 8th-Grade Math (Raw) | ~281 | ~267 | ~274 |
| National Rank Range | 1st -10th | 30th – 48th |
This advantage is likely a function of non-school systemic drivers like lower child poverty rates, higher median family income, and higher per-pupil spending. Raw NAEP test scores do not intentionally measure accrued socioeconomic privilege; they do correlate with it since “privilege” is a strong predictor of how well K-12 students perform on standardized tests. Table 2 compares the non-school drivers of childhood poverty rate, median family income, and per-pupil spending between the group of blue and red states.3
| Indicator/ metric | Blue state cohort (MA, CT, NJ & VT) | Red state cohort (TX, MS, AL, & LA) | National Base |
| Childhood poverty rate | ~10-13% | ~19-27% | ~16-17% |
| Median family income | $105,000- $180,000 | ~$65,000- $80,000 | ~$90,000 |
| Per-pupil K-12 spending | $22,000- $26,000 | $10,000- $14,000 | ~$15,500 |
| Poverty exposure ratio | ~1 in 8 children live in poverty | Up to 1 in 4 children live in poverty | ~1 in 6 children live in poverty |
In 2024, the Urban Institute performed an analysis of NAEP data that was adjusted for demographics; for example, race, ethnicity, income/Pell Grant status, special education, and English Language Learner (ELL) status.4 Red states like Mississippi, Florida, and Texas jump dramatically into top national rankings for NAEP data.
In a New York Times article, How Mississippi Transformed Its Schools from Worst to Best,5 we learn what the state did to achieve substantial growth in 4th-grade reading by pairing an evidence-based “Science of Reading” with strict early interventions. As a result, Mississippi’s 4th-grade reading rank soared from 49th nationally in 2013 to 9th. When adjusted for demographics and poverty, Mississippi’s 4th-grade students now rank #1 in the nation (Variables 9 and 10 in Complex Adaptive System flowchart below).
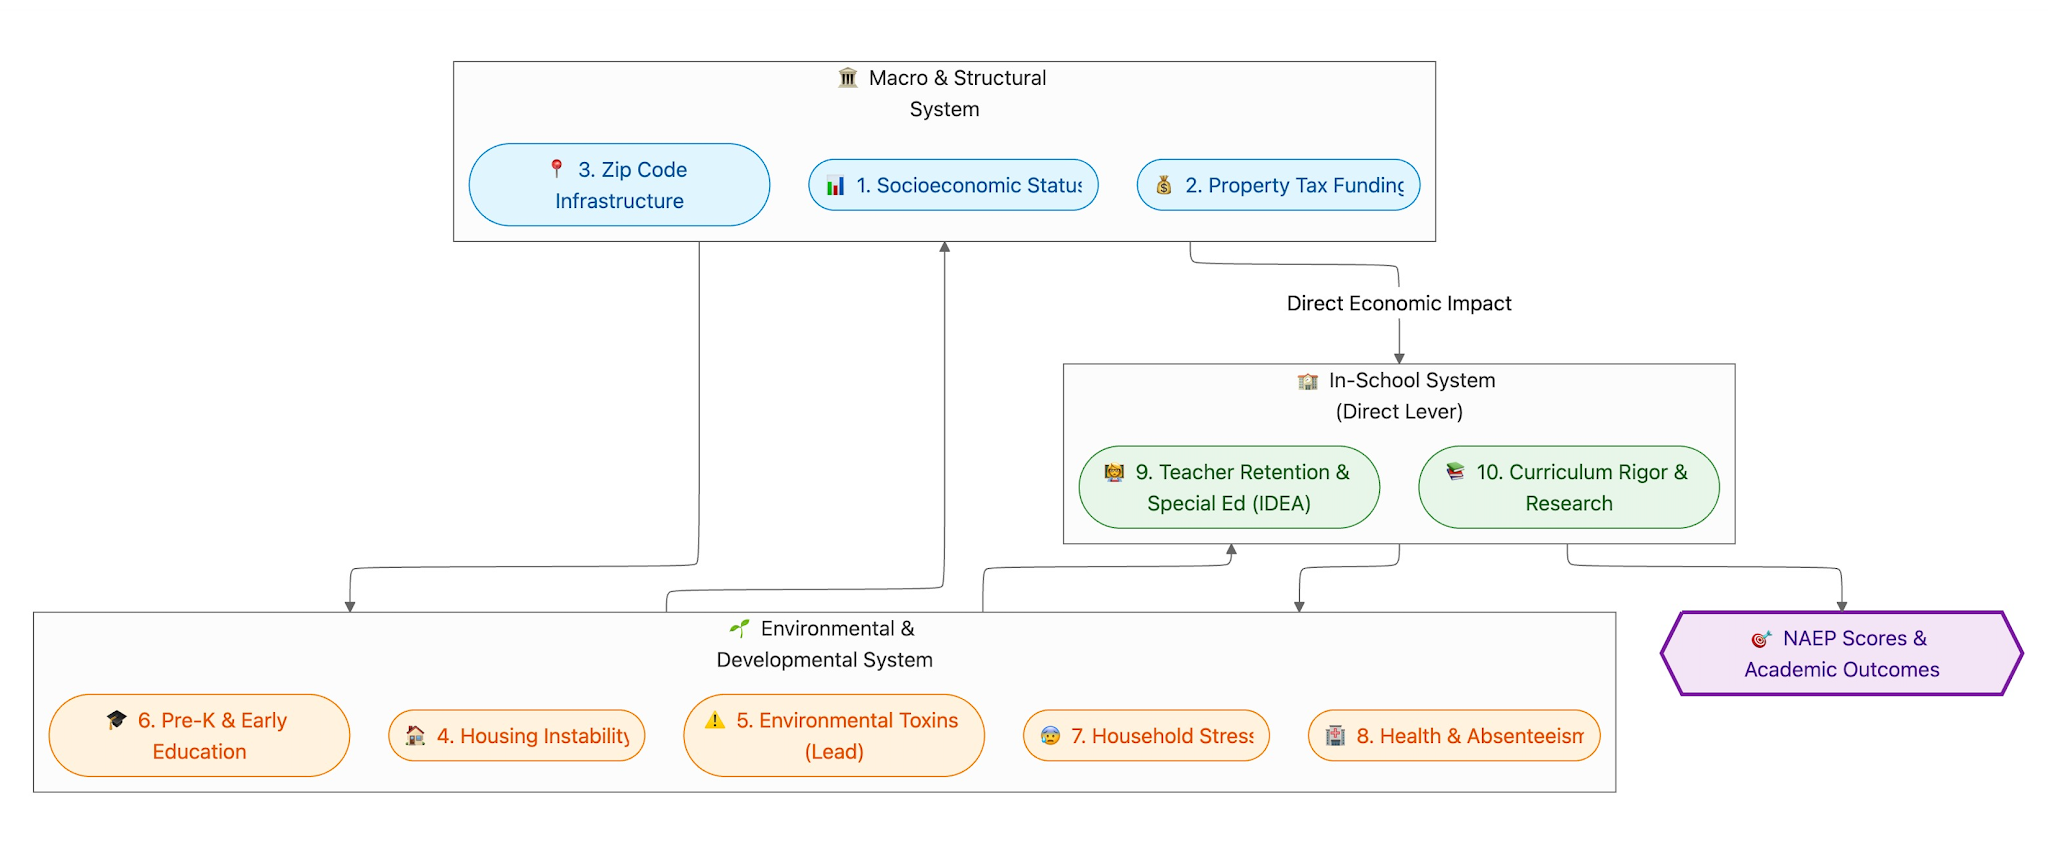
One takeaway: raw scores reflect the baseline environment in which a child lives, while adjusted scores measure the value added by classroom instruction relative to baseline disadvantage. The point is that in a complex adaptive system, we have to look at the data through multiple lenses to get the overall picture of how the system is impacted over time.
Poverty, Health, & Early Childhood (Variables 1, 6, 8 — Blue State Strengths)
Blue states, like MA, VT, CT, and MN, lead the United States in child health insurance coverage (~2% uninsured in MA vs. ~14% in TX). In these four blue states, families have access to state-subsidized Pre-K, and Vermont supports universal pre-K. While TX, MS, LA, and AL offer eligibility-based pre-K, leaving many families scrambling.
Environmental Toxins & Housing Dynamics (Variables 4, 5 — The Counterintuitive Trade-offs)
In 1978, the Consumer Product Safety Commission (CPSC) banned the manufacture and sale of lead-containing paint for use in homes, childcare facilities, and preschools.6 Older, high-spending Northeastern blue states, like NY, PA, and MA, face risks from pre-1978 lead paint housing stock. Whereas fast-growing Sunbelt Red states, like FL, TX, and NV (a purple state), benefit from newer construction that dramatically reduces early lead poisoning risks.
Out-of-reach housing costs in some blue state metro areas in CA, NY, or MA burden about 30–35% of families. This drives residential instability, especially for families that are economically disadvantaged. Whereas lower living and housing costs in Midwestern or Southern red states offer relative housing affordability. However, this can be offset by weaker safety-net protections for families who fall into poverty.
The Federal Government as a Partner and Stabilizer
A Blue state model that provides health insurance and high spending, but might ignore evidence-based reading instruction, for example, underperforms its potential in meeting all students’ needs.
A Red state model that implements strong reading mandates, but ignores many of the non-school drivers, like child health coverage, state-subsidized early childhood programs, or local tax equity, needs to wrestle with the impact of unmitigated poverty.
In both of these models, the ED can be an effective partner through targeted support that levels the playing field across the non-school drivers that impact student learning outcomes. The Department can work to stabilize the educational environment in states that are overwhelmed by having to balance their budgets year-to-year. In this way, the Department can work to ensure, regardless of the state a student is born into, access to high-quality education will be supported.
Here are a few examples of the Department of Education serving as a cross-state stabilizer. First, the government’s Title I initiative injects needed resources into lower-tax red states, like MS, LA, or TX, to offset localized property tax deficits. Second. Individuals with Disabilities Act (IDEA) and Civil Rights legislation guarantee that neither red nor blue states neglect students with disabilities or marginalized groups. In that respect, these students are not jeopardized by cost-cutting or local political agendas. Finally, the Institute for Education Sciences and other research-funded initiatives provide valuable information on instructional and curricular innovations, like Mississippi’s early literacy framework, to all 50 states.
Conclusion: Moving from Partisan Rhetoric to Systemic Alignment
National educational policy should not be reduced to overly simplistic red vs. blue stereotypes. We must embrace the idea that K-12 public school education is a complex adaptive system. Research data confirms that public education flourishes when there is structured support of the non-school drivers, like healthcare, housing stability, and funding equity. In addition, states need to draw on federally funded research that aligns instructional and curricular innovations, like project-based learning, science of reading, or Singapore math, to name three, to improve student outcomes.
John F. Kennedy left an enduring metaphor7 that speaks to the importance of maintaining a healthy and well-resourced Department of Education that serves to coordinate a plethora of programs designed to meet all students’ needs.
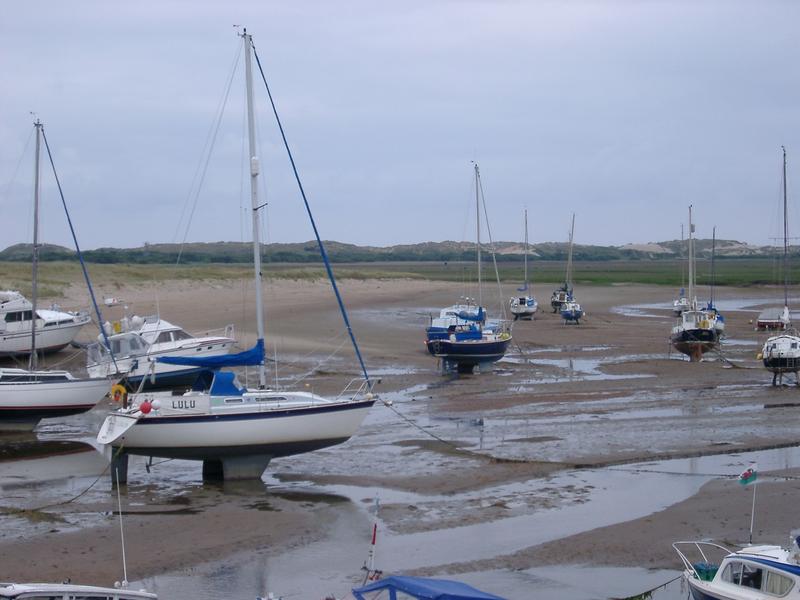
“A rising tide lifts all boats”8
Dismantling the Department of Education would abandon the nation’s 50 million students to regional “lottery systems.” Instead of discarding federal oversight, national policy should combine the safety nets of blue states with the instructional discipline of high-performing red states—fulfilling a collective responsibility to the complex adaptive system we have built. In this way, the Federal Government will support the “common good.”
References:
The featured photo (unedited) for the Golden Gate Bridge comes from Jason Wong, Copyright 2007-2021 Jason Wong. (click here for link to the photo)
Footnotes:
- A system that is complex and comprised of interconnected components that are interdependent. An ecosystem, like a rainforest, would be an example. ↩︎
- The Nation’s Report Card. ↩︎
- A state-level perspective on school spending and educational outcomes, Brookings Institute, September 2025. ↩︎
- Urban Institute, States’ Demographically Adjusted Performance on the 2024 National Assessment of Educational Progress, January 2025. ↩︎
- How Mississippi Transformed Its Schools From Worst to Best, New York Times, by Sarah Mervosh, January 2026. ↩︎
- https://www.epa.gov/lead/protect-your-family-sources-lead ↩︎
- I shared this metaphor in a previous essay, The Fallacy of Single_Metric Evaluation: Education is a Complex Adaptive System, August 2, 2026. ↩︎
- https://en.wikipedia.org/wiki/A_rising_tide_lifts_all_boats ↩︎
- Attribution for the photo of boats at low tide. image by freeimageslive.co.uk – gratuit ↩︎


Leave a Reply