Is Climate Change Real? Here are 9 Scientific Facts
Introduction
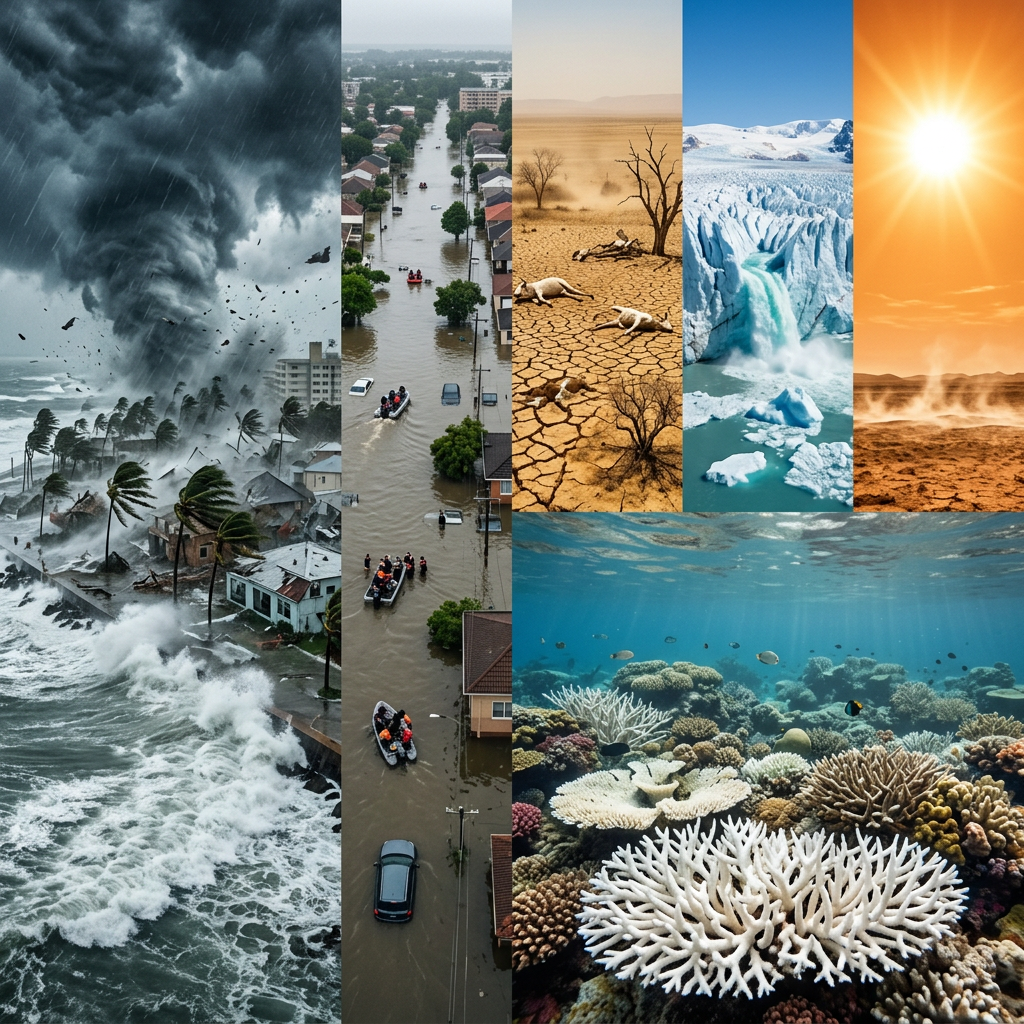
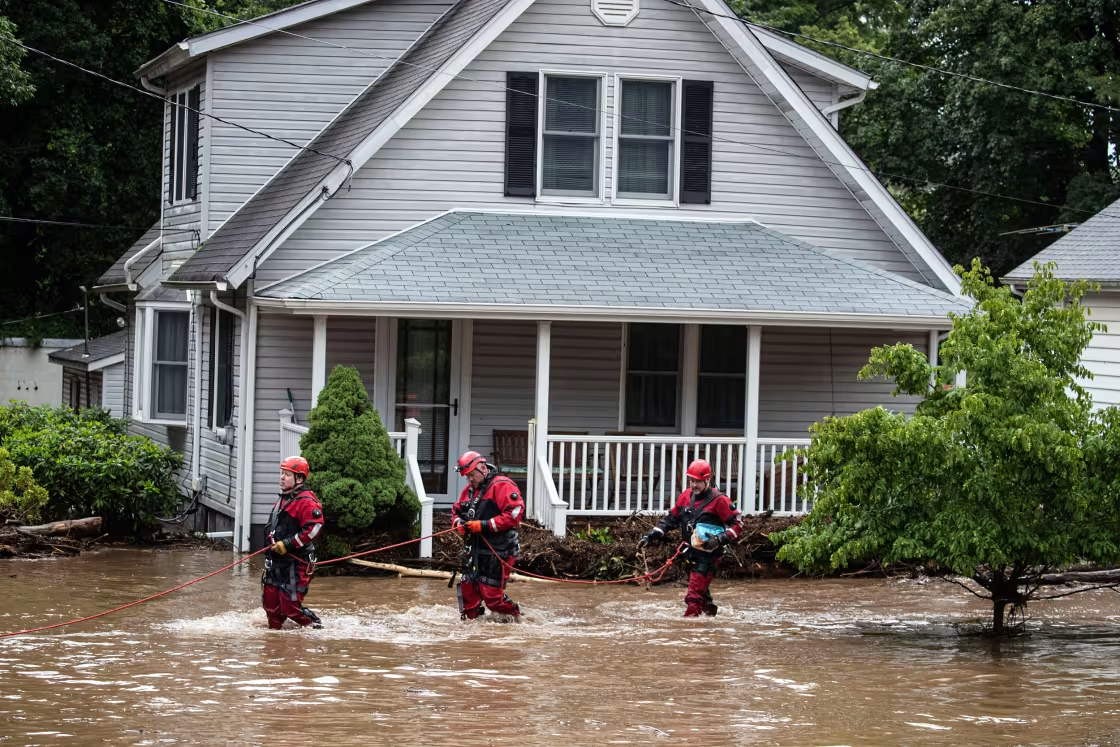
I was watching the news the other night and was again confronted with devastating flooding, this time in the Northeast, and extremely uncomfortable temperatures and humidity plaguing the World Cup 2026 matches in New York/New Jersey.1
As a scientist and educator, I follow the scientific evidence and thinking on the question: Is climate change real or a ruse? I remain concerned that many politicians and a segment of our society think it’s a hoax.
So I thought I would outline the agreed-upon evidence that informs climate scientists’ thinking about the status of our “warming planet.” Learning the facts associated with the Earth’s climate builds a mental toolbox. It allows each of us to understand new information as it arises, help solve our current challenges, and think creatively and independently. We need to be informed citizens who can discern truth from falsehoods.
National Aeronautics and Space Administration (NASA) has been diligently collecting data related to the question at hand. Here are their nine pieces of evidence that convince over 99% of climate scientists that the Earth is warming faster than at any time in recorded history. This quote from the Intergovernmental Panel on Climate Change (IPCC) is compelling.
“Scientific evidence for warming of the climate system is unequivocal.”2
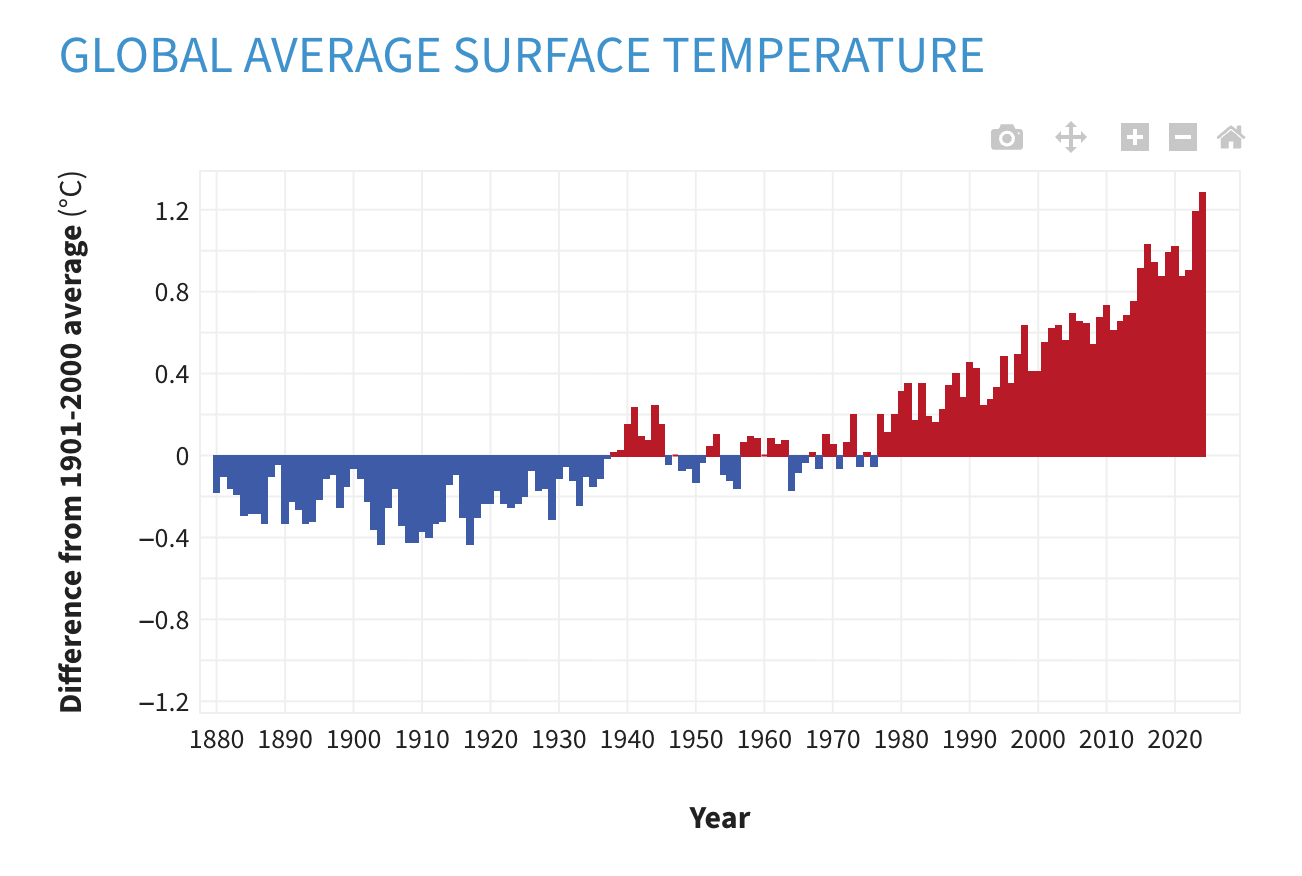
Graph 1 illustrates that yearly surface global temperatures have been rising since 1940.4
The Oceans are Getting Warmer
Our vast oceans act as a heat sink, absorbing excess energy. A slight change in ocean temperature has catastrophic effects on Earth’s climate.
The Ice Sheets are Shrinking
Greenland lost an average of 279 billion tons of ice per year between 1993 and 2019, while Antarctica lost about 148 billion tons of ice per year. While the percent of total ice is small, 0.01%, the scale and impact can be large over time.
Glaciers are Retreating
Glaciers around the world are disappearing. Alaska contains nearly 16,000 gigatons of glacier ice. Glaciers in the state are thinning so quickly that they account for 25% of all ice loss from global glaciers.5 See How Europe’s Heat Waves Melted the Alps’ Glaciers.6
Snow Cover is Decreasing
Graph 2 illustrates the dramatically lower levels of snow-water equivalent in the Colorado Rockies.
Sea Level is Rising
Graph 3 shows that the global mean sea level has risen about 8–9 inches (21–24 centimeters) since 1880.7
Arctic Sea Ice is Declining
Extreme Weather Events are Increasing
In 2025, the U.S. recorded 23 separate weather and climate disasters that caused at least $1 billion each in damages. Globally, there were 55 such billion-dollar disasters. This followed a clear upward historical trend, placing 2025 as the third-highest year on record for costly U.S. climate disasters.8
Ocean Acidification is Increasing
The oceans absorb carbon dioxide, which results in the acidification of the water. Since the beginning of the Industrial Revolution, the acidity of surface ocean waters has increased by about 30%, which has negative impacts on the oceans’ biotic and abiotic ecosystems.
The CO2 Connection
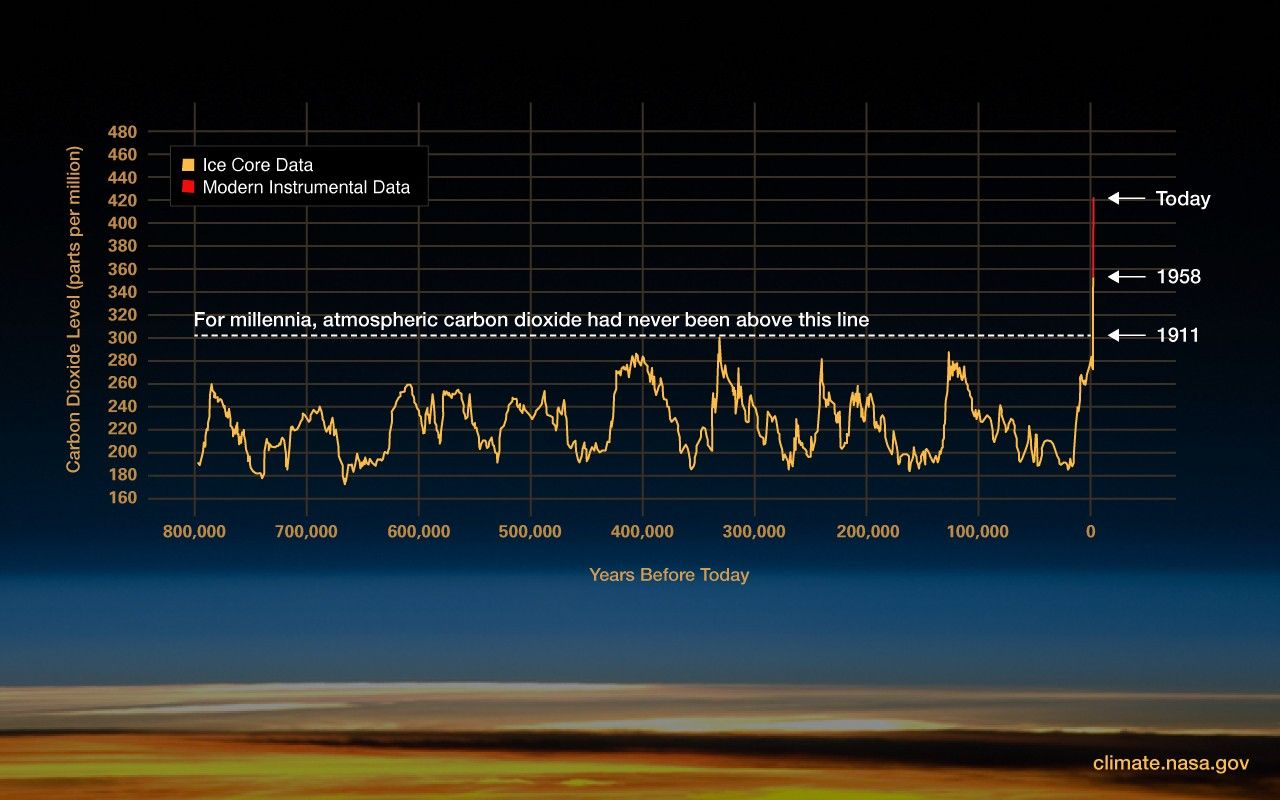
Many of the nine pieces of evidence for climate change are tied directly to human activity, which is leading to an increase in global temperatures. The main culprit is increasing “greenhouse gases” like carbon dioxide (CO2). Increasing CO2 levels in the atmosphere are driven by burning fossil fuels, deforestation, cement production, factory farming, agricultural practices, and warmer temperatures and natural feedback systems. Graph 4 below shows carbon dioxide levels from ice cores that can be dated going back nearly 800,000 years. For these 800,000 years, levels of CO2 have never been above 300 parts per million. Starting around 19119 until the present day, CO2 levels have increased by 40% to 420 parts per million. Carbon dioxide is a greenhouse gas that acts as a reflective shield in the atmosphere, preventing the sun’s energy from escaping. Hence, the planet warms.
Conclusion
Any one piece of data presents us with a complex challenge to solve; however, nine pieces of data present us with a crisis to address. The challenge before us is to understand the interconnections of these complex systems: the atmosphere, CO2 cycle, water cycle, ocean ecosystems, glaciers, and the biotic and abiotic systems embedded or impacted by each of these systems.
Being a learner is critical to our survival. With regard to climate change, we must be open to what experts think, understand the data as best we can, and block out the political noise that is designed to manipulate or distract us. Future generations around the globe hang in the balance.
Graphs 1-4
Graph 1: Yearly surface temperature from 1880–2024 compared to the 20th-century average (1901-2000).Graph 2: Snow water equivalent in CO since 1987.Graph 3: Global Sea-level rise since 1880Graph 4: from NASA showing levels of CO2 over the past 800,000 years10
Note: the Industrial Revolution started around 1750 in England and found its way to Europe and America around 1840. It represents the beginning of our extensive use of fossil fuels. ↩︎
NASA, Evidence, for climate change, the nine drivers. ↩︎




Leave a comment